Point detection
Precision, Recall, and Standard-F1 assess individual anomalous timestamps. AUC-PR and AUC-ROC compare score quality across thresholds.
We introduce mTSBench, a benchmark for comparing multivariate time-series anomaly detectors and selecting models when anomaly labels are unavailable. mTSBench’s unified evaluation across diverse datasets shows how detector performance changes across domains and where current model-selection methods fall short.
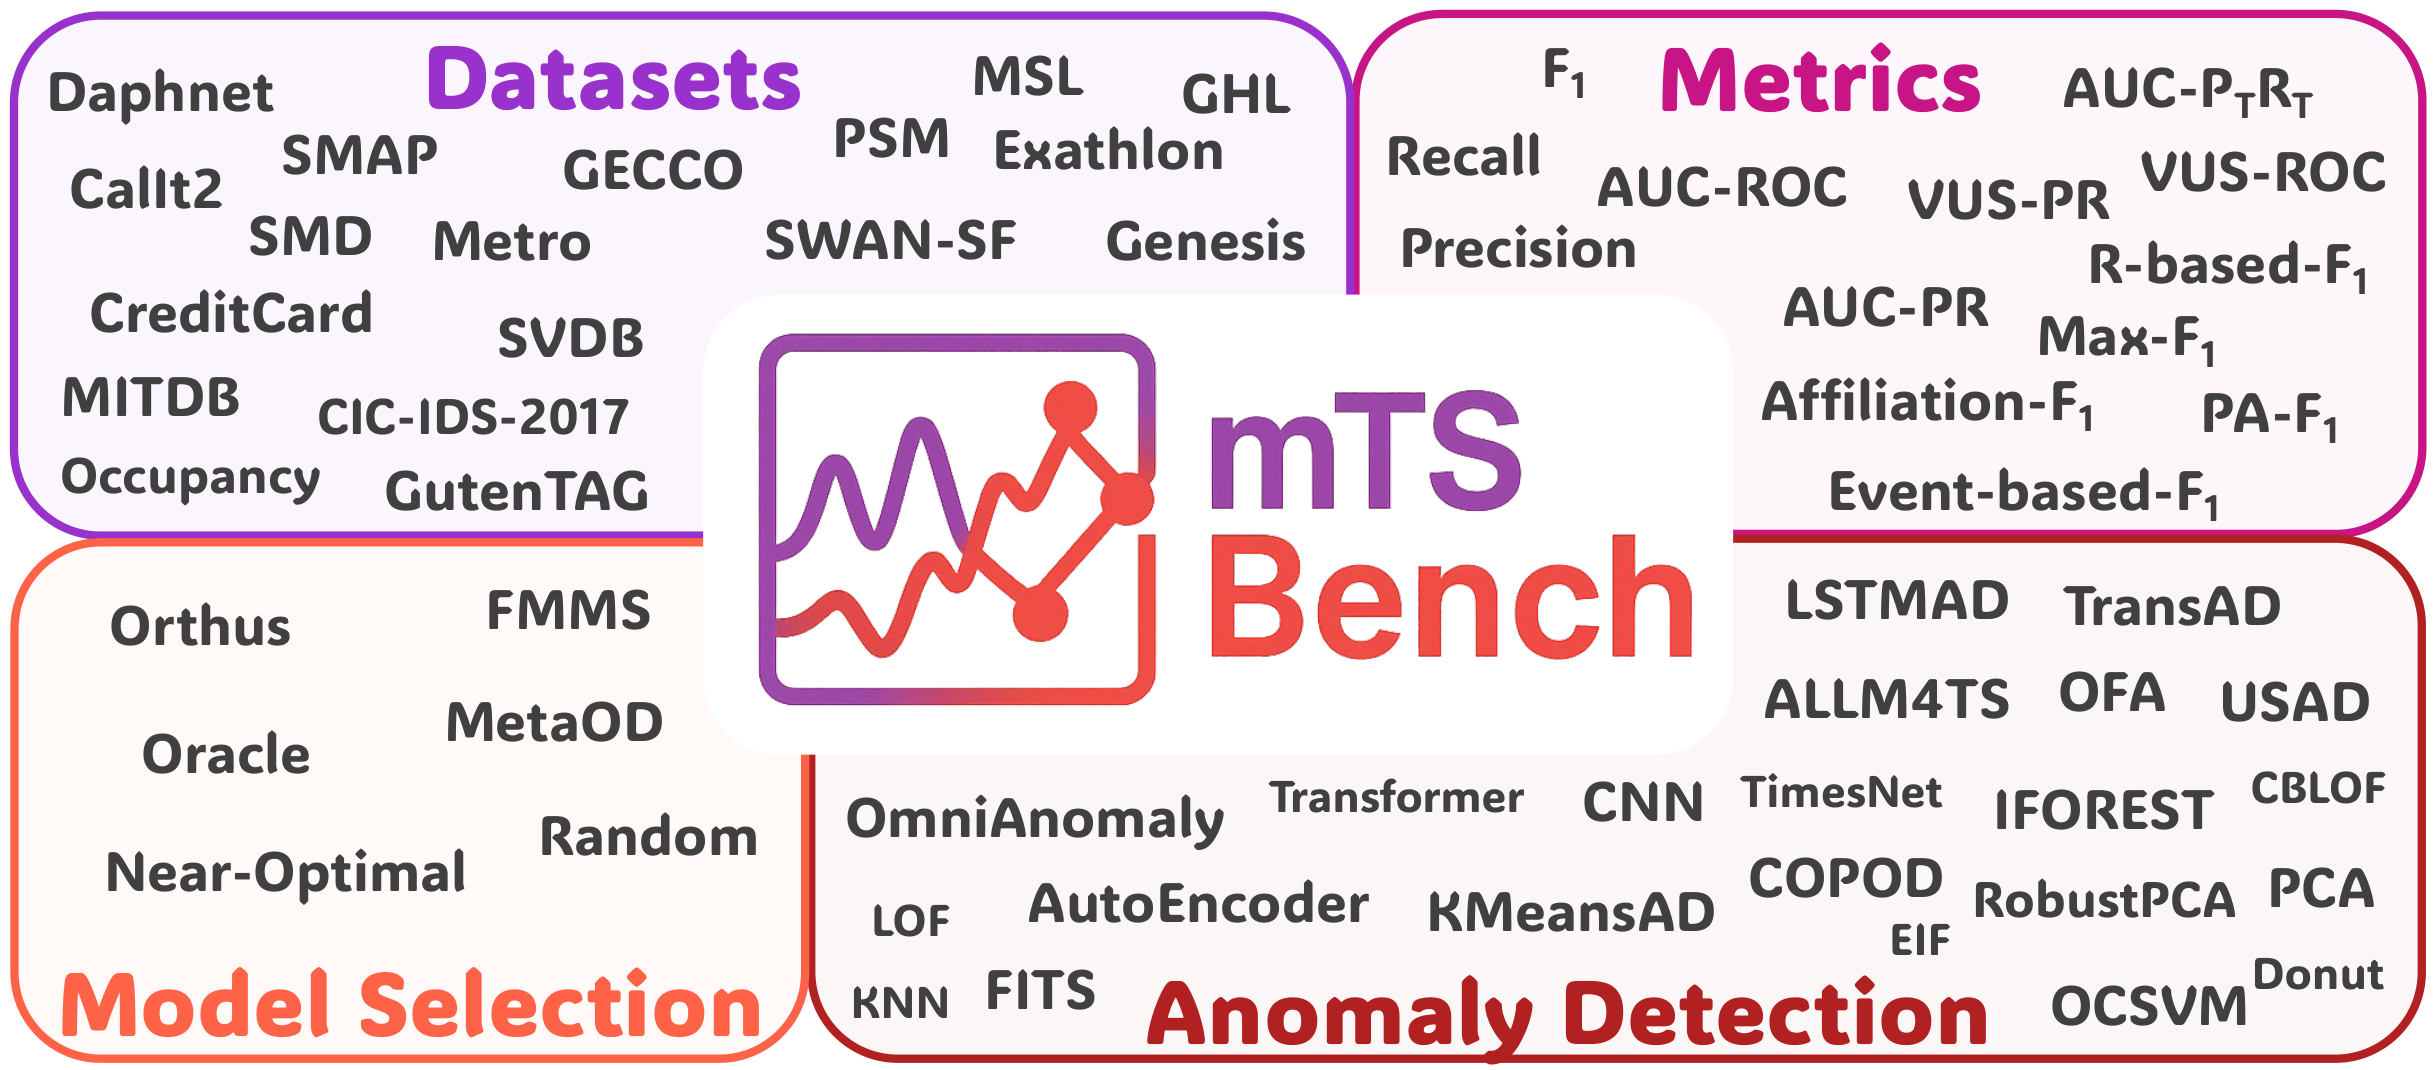
A common evaluation suite connects diverse multivariate datasets with anomaly detectors and unsupervised model selectors.
mTSBench is a benchmark for multivariate time-series anomaly detection and model selection. It brings together 344 labeled time series from 19 datasets across 12 application domains, and evaluates 24 statistical, deep-learning, and language-model-based detectors under a unified protocol. The benchmark also evaluates unsupervised selection methods using consistent point-based and ranking-based metrics. Results show that no single detector performs consistently well across datasets and that current model selectors remain far below oracle performance, motivating adaptive, data-aware selection strategies.
mTSBench brings datasets, anomaly detectors, model selectors, and evaluation tools into one reproducible package. Load a labeled multivariate series, run a detector through a common interface, and compare accuracy, event coverage, and runtime. The same suite evaluates which detector a selector recommends for new data.
Precision, Recall, and Standard-F1 assess individual anomalous timestamps. AUC-PR and AUC-ROC compare score quality across thresholds.
PA-F1, Event-based-F1, R-based-F1, and Affiliation-F evaluate anomaly intervals. AUC-PₜRₜ, VUS-PR, and VUS-ROC measure range-aware detection across thresholds and temporal tolerances.
MetaOD, FMMS, and Orthus recommend detectors without anomaly labels at selection time. Precision@k, Recall@k, and NDCG@k assess which recommendations recover strong detectors and how well they are ranked.
The 24 detectors span distance and density methods, isolation and clustering, statistical and subspace models, neural reconstruction and forecasting, and language-model approaches. This breadth supports comparisons across model families under one evaluation interface.
The datasets cover healthcare, cybersecurity, industrial processes and automation, spacecraft telemetry, cloud computing, IT infrastructure, smart buildings, finance, transportation, water quality, human activity, and synthetic anomalies. They include both isolated anomalous points and sustained anomaly sequences.
| Dataset | Domain | Time series | Dimensions | Length | Anomaly points | Anomaly sequences | License |
|---|---|---|---|---|---|---|---|
| CIC-IDS-2017 (2017) | Cybersecurity | 4 | 73 | >100K | 0–8656 | 0–2546 | Citation required |
| CalIt2 (2006) | Smart Building | 1 | 2 | >5K | 0 | 21 | CC BY 4.0 |
| CreditCard (2018) | Finance / Fraud Detection | 1 | 29 | >100K | 219 | 10 | Citation required |
| Daphnet (2009) | Healthcare | 26 | 9 | >50K | 0 | 1–16 | CC BY 4.0 |
| Exathlon (2021) | Cloud Computing | 30 | 20 | >50K | 0–4 | 0–6 | Apache 2.0 |
| GECCO (2018) | Water Quality Monitoring | 1 | 9 | >50K | 0 | 37 | Citation required |
| GHL (2016) | Industrial Process | 14 | 16 | >100K | 0 | 1–4 | Contact authors |
| Genesis (2018) | Industrial Automation | 1 | 18 | >5K | 0 | 2 | CC BY-NC-SA 4.0 |
| GutenTAG (2022) | Synthetic Benchmark | 30 | 20 | >10K | 0 | 1–3 | MIT |
| MITDB (2000) | Healthcare | 47 | 2 | >500K | 0 | 1–720 | ODC-By v1.0 |
| MSL (2018) | Spacecraft Telemetry | 26 | 55 | >5K | 0 | 1–3 | BSD 3-Clause |
| Metro (2015) | Transportation | 1 | 5 | >10K | 20 | 5 | CC BY 4.0 |
| OPPORTUNITY (2010) | Human Activity Recognition | 13 | 32 | >25K | 0 | 1 | CC BY 4.0 |
| Occupancy (2016) | Smart Building | 2 | 5 | >5K | 1–3 | 9–13 | CC BY 4.0 |
| PSM (2021) | IT Infrastructure | 1 | 26 | >50K | 0 | 39 | CC BY 4.0 |
| SMAP (2018) | Spacecraft Telemetry | 48 | 25 | >5K | 0 | 1–3 | BSD 3-Clause |
| SMD (2019) | IT Infrastructure | 18 | 38 | >10K | 0 | 4–24 | MIT |
| SVDB (1990) | Healthcare | 78 | 2 | >100K | 0 | 2–678 | ODC-By v1.0 |
| SWAN-SF (2020) | Industrial Process | 1 | 38 | >50K | 5233 | 1382 | MIT |
Average AUC-ROC Performance of 24 Anomaly Detection Methods (x-axis) Evaluated Across 19 mTSBench Datasets (y-axis). The substantial performance variability across datasets highlights the need for robust model selection strategies. mTSBench benchmarks the capabilityof model selection techniques to systematically identify the optimal anomaly detection method among 24 state-of-the-art detectors evaluated on a comprehensive collection of 344 multivariate time series.
Boxplots summarize the performance of anomaly detection methods across all mTSBench datasets using five evaluation metrics: VUS-PR, VUS-ROC, AUC-PR, AUC-ROC, and AUC-PTRT. Methods are ordered by their average VUS-PR score. Boxes indicate interquartile ranges, with the solid line denoting the median and the dashed line denoting the mean. There is clear performance stratification among anomaly detectors across the five evaluation metrics. PCA, OmniAnomaly, and OFA achieve higher median scores, particularly on VUS-PR, VUS-ROC, and AUC-ROC, while methods such as KNN, Transformer, LOF, and HBOS consistently occupy the lower end of the performance spectrum, with poor AUC-PR and AUC-PTRT indicating difficulty handling highly imbalanced and threshold-sensitive anomaly detection settings.
The top panel reports the average runtime of each anomaly detection method evaluated on 344 multivariate time series in mTSBench. Among the 24 methods, IForest is the most efficient, followed by ALLM4TS and MCD, while AnomalyTransformer has the highest computational cost and OFA is the second most expensive. The bottom panel presents a heatmap showing the mean runtime of all detectors across the 19 datasets.
Detector-selection quality for MetaOD, FMMS, and Orthus across the benchmark’s scoring metrics.
| Metric | Oracle | Near-optimal | Random | PCA | MetaOD | FMMS | Orthus | Ensemble | Δ (%) |
|---|---|---|---|---|---|---|---|---|---|
| F1 | 0.546 ± 0.263 | 0.514 ± 0.256 | 0.299 ± 0.252 | 0.252 ± 0.195 | 0.135 ± 0.135 | 0.222 ± 0.185 | 0.222 ± 0.200 | 0.189 ± 0.187 | -56.80 |
| Precision | 0.414 ± 0.328 | 0.393 ± 0.319 | 0.194 ± 0.236 | 0.293 ± 0.305 | 0.189 ± 0.236 | 0.280 ± 0.299 | 0.297 ± 0.311 | 0.237 ± 0.262 | -24.43 |
| Recall | 0.483 ± 0.298 | 0.458 ± 0.287 | 0.275 ± 0.313 | 0.319 ± 0.310 | 0.205 ± 0.210 | 0.307 ± 0.276 | 0.283 ± 0.271 | 0.300 ± 0.301 | -32.97 |
| Affiliation-F1 | 0.879 ± 0.107 | 0.868 ± 0.101 | 0.785 ± 0.124 | 0.818 ± 0.108 | 0.777 ± 0.100 | 0.834 ± 0.112 | 0.814 ± 0.111 | 0.792 ± 0.107 | -3.92 |
| Event-based-F1 | 0.699 ± 0.287 | 0.667 ± 0.283 | 0.427 ± 0.338 | 0.506 ± 0.329 | 0.377 ± 0.305 | 0.548 ± 0.333 | 0.500 ± 0.340 | 0.433 ± 0.330 | -17.84 |
| Max-F1 | 0.546 ± 0.263 | 0.514 ± 0.256 | 0.299 ± 0.252 | 0.408 ± 0.268 | 0.292 ± 0.246 | 0.381 ± 0.263 | 0.386 ± 0.270 | 0.379 ± 0.270 | -24.90 |
| PA-F1 | 0.825 ± 0.235 | 0.803 ± 0.226 | 0.705 ± 0.316 | 0.627 ± 0.320 | 0.658 ± 0.324 | 0.738 ± 0.285 | 0.647 ± 0.332 | 0.584 ± 0.332 | -8.09 |
| R-based-F1 | 0.450 ± 0.237 | 0.430 ± 0.224 | 0.252 ± 0.190 | 0.410 ± 0.237 | 0.242 ± 0.194 | 0.366 ± 0.224 | 0.370 ± 0.236 | 0.328 ± 0.246 | -13.95 |
| AUC-PtRt | 0.417 ± 0.276 | 0.400 ± 0.260 | 0.234 ± 0.228 | 0.322 ± 0.278 | 0.217 ± 0.218 | 0.318 ± 0.273 | 0.309 ± 0.272 | 0.278 ± 0.260 | -20.50 |
| AUC-PR | 0.492 ± 0.296 | 0.455 ± 0.284 | 0.212 ± 0.222 | 0.327 ± 0.280 | 0.210 ± 0.231 | 0.304 ± 0.266 | 0.315 ± 0.279 | 0.287 ± 0.271 | -30.77 |
| AUC-ROC | 0.811 ± 0.150 | 0.796 ± 0.148 | 0.613 ± 0.178 | 0.697 ± 0.219 | 0.605 ± 0.189 | 0.659 ± 0.207 | 0.672 ± 0.219 | 0.683 ± 0.214 | -15.58 |
| VUS-PR | 0.524 ± 0.296 | 0.485 ± 0.290 | 0.236 ± 0.236 | 0.348 ± 0.290 | 0.229 ± 0.231 | 0.326 ± 0.277 | 0.333 ± 0.288 | 0.312 ± 0.279 | -31.34 |
| VUS-ROC | 0.847 ± 0.134 | 0.832 ± 0.134 | 0.640 ± 0.188 | 0.721 ± 0.211 | 0.655 ± 0.179 | 0.698 ± 0.204 | 0.707 ± 0.212 | 0.714 ± 0.203 | -15.02 |
Recall as the number of recommended detectors increases.
Ranking Comparison of Model Selection Methods. (Left) Precision@3, Recall@3, and NDCG@3 for each method. (Right) Recall@k as a function of k. In the Top-3 setting (left), Orthus achieves the highest scores across all ranking metrics, followed by FMMS and then MetaOD, while the Recall@k curves (right) show that Orthus and FMMS alternate in ranking quality across different values of k, with MetaOD consistently performing worse.
| Metric | MetaOD | FMMS | Orthus |
|---|---|---|---|
| NDCG@3 (%) ↑ | 11.19 | 29.44 | 33.19 |
@article{zhou2026mTSBench,
  title={mTSBench: Benchmarking Multivariate Time Series Anomaly Detection and Model Selection at Scale},
  author={Zhou, Xiaona and Brif, Constantin and Lourentzou, Ismini},
  journal={Transactions on Machine Learning Research (TMLR)},
  year={2026}
}This site is built upon the work of Nerfies, made available under the Creative Commons Attribution-ShareAlike 4.0 International License. We gratefully acknowledge LLaVA, MiniGPT-4, LLaMa, and Stable Diffusion 2 for open-sourcing their models and code.